| It
is not as important what the Speculative Funds,
Commercial Hedgers and Index Funds have done from
one week to the next as it is critically important
what they have done over the course of weeks and
months. The indicator I have developed uses moving
averages as a way to accurately measure the longer
term supply/demand trends of these three constituencies.
Thus, short term gyrations do not mask the true
money flow direction of the market.
The important thing to remember is that Large
Speculators are like sprinters. They run fast
and hard and they move markets. Commercial hedgers
are more like turtles. They are always on the
other side of the trade to the speculators and
slowly increase their supply in an up market or
gradually increase their buying in a down market.
Commercial hedgers create the liquidity in the
market.
Indexers are long only funds and are typically
not allowed to go short. They must buy all the
components of an index in the right percentages
to maintain integrity with following the index’s
performance. They are not typically actively managed
funds. If money flows into the Index funds they
must buy all of the components of the index and
if money flows out of the Index funds they must
sell all of the components of the underlying index.
They also must rebalance typically every quarter
to maintain a true direct relation to the index.
For example if Corn goes up 50 percent during
a quarter and Soybeans are unchanged then the
funds would have to sell corn and buy Soybeans
to re-weight the Index Fund back to the appropriate
percentages as prescribed by the index. At quarter
end is also a time that new monies that have come
into the fund can be deployed in a larger scale
more readily. Hence, quarter end can be a time
a great volatility in commodity markets when these
index fund activities are transpiring.
When the Large Speculative Funds and Index funds
are buying more aggressively than the Commercial
hedgers are willing to sell, the market must go
up until supply and demand get back into balance.
When Large Speculative Funds and Index Funds are
selling more aggressively then the Commercials
are buying, the market must go down until the
supply and demand get back into balance. It is
a very straight forward and simple approach.
At the end of the day, it means very little what
anyone person thinks the fundamentals or technical
are saying about a market. What really matters
is what the Large Speculators, Index funds and
Commercial Hedgers think the technical and fundamentals
are saying about the market. Recognize how they
are acting and you will have a better sense for
the character of the particular trend at hand.
Let us look at a real world example to illustrate
this.
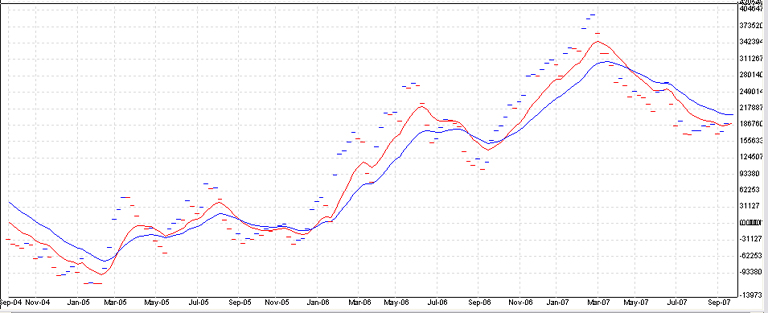
Below
I have a 3 year chart of Corn. Notice that back
in September of 2006 the red line crossed back
over the blue line. This indicated that the buyers
were exceeding sellers and that the money flow
in the market was showing a positive turn. Also
notice that the money flow kept coming into the
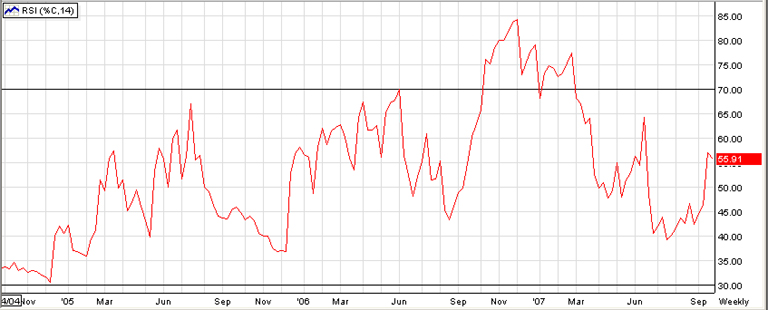
market until it peaked in late February. When
the money flow indicator signaled a buy in September
of 2006 it was accompanied by an oversold RSI
index. When both indicators confirm a buy signal
a recommendation is put out to buy. Let’s
take a look at the situation in Late February.
As
you can see the RSI Index was extremely overbought
and the money flow indicator began to turn down.
When these 2 conditions exist caution is warranted
and a more defensive posture is required. When
the RSI is over bought and the money flow indicator
starts to decline a recommendation to sell will
be made to subscribers. A supplemental sell signal
will be issued to subscribers when the red line
crosses the green line as it did in late March
indicating that the money flow has accelerated
and that sellers have becoming more dominant in
the market. The money has continued to flow out
of the Corn market until stabilizing just recently.
I would like to make another point regarding the
rally in late June. Notice the market made a big
move up to the 425 area but that the money flow
indicator did not CONFIRM THIS MOVE HIGHER. This
was a classic example of a market that was going
through a false rally. When a market is moving
up but the money is Not flowing into that market
the sustainability of such a move is very suspect.
When such divergences exist a sell (buy in the
opposite case) will be issued to subscribers.
Once again I believe this Money Flow analysis
is powerful and gives a valuable tool when used
in combination with other considerations. Of course
nothing is perfect and there will be times when
this system will not perform as well. But in the
15 years of managing markets I have come to appreciate
the liquidity factors in markets and be able to
benefit from reading the signals between the tea
leaves
3-Year Corn Chart

Money
Flow Indicator
RSI Index
If you have any questions regarding the above analysis
or would like to look at a different agricultural
market then please call me at 888-535-5525
or e-mail shawn@hackettadvisors.com.
Sincerely,

President, Hackett Financial Advisors, Inc.
|